

Read conclusions, not noise.
Most monitoring hands you a wall of charts and lets you find the problem. JuhJuh does the first pass for you. Uptime, errors, infrastructure, applications, traces, real user sessions, and container logs. Every signal is collected, indexed, and correlated, then surfaced as root-caused issue cards. All linked back to the Tasks and deploys that produced them.
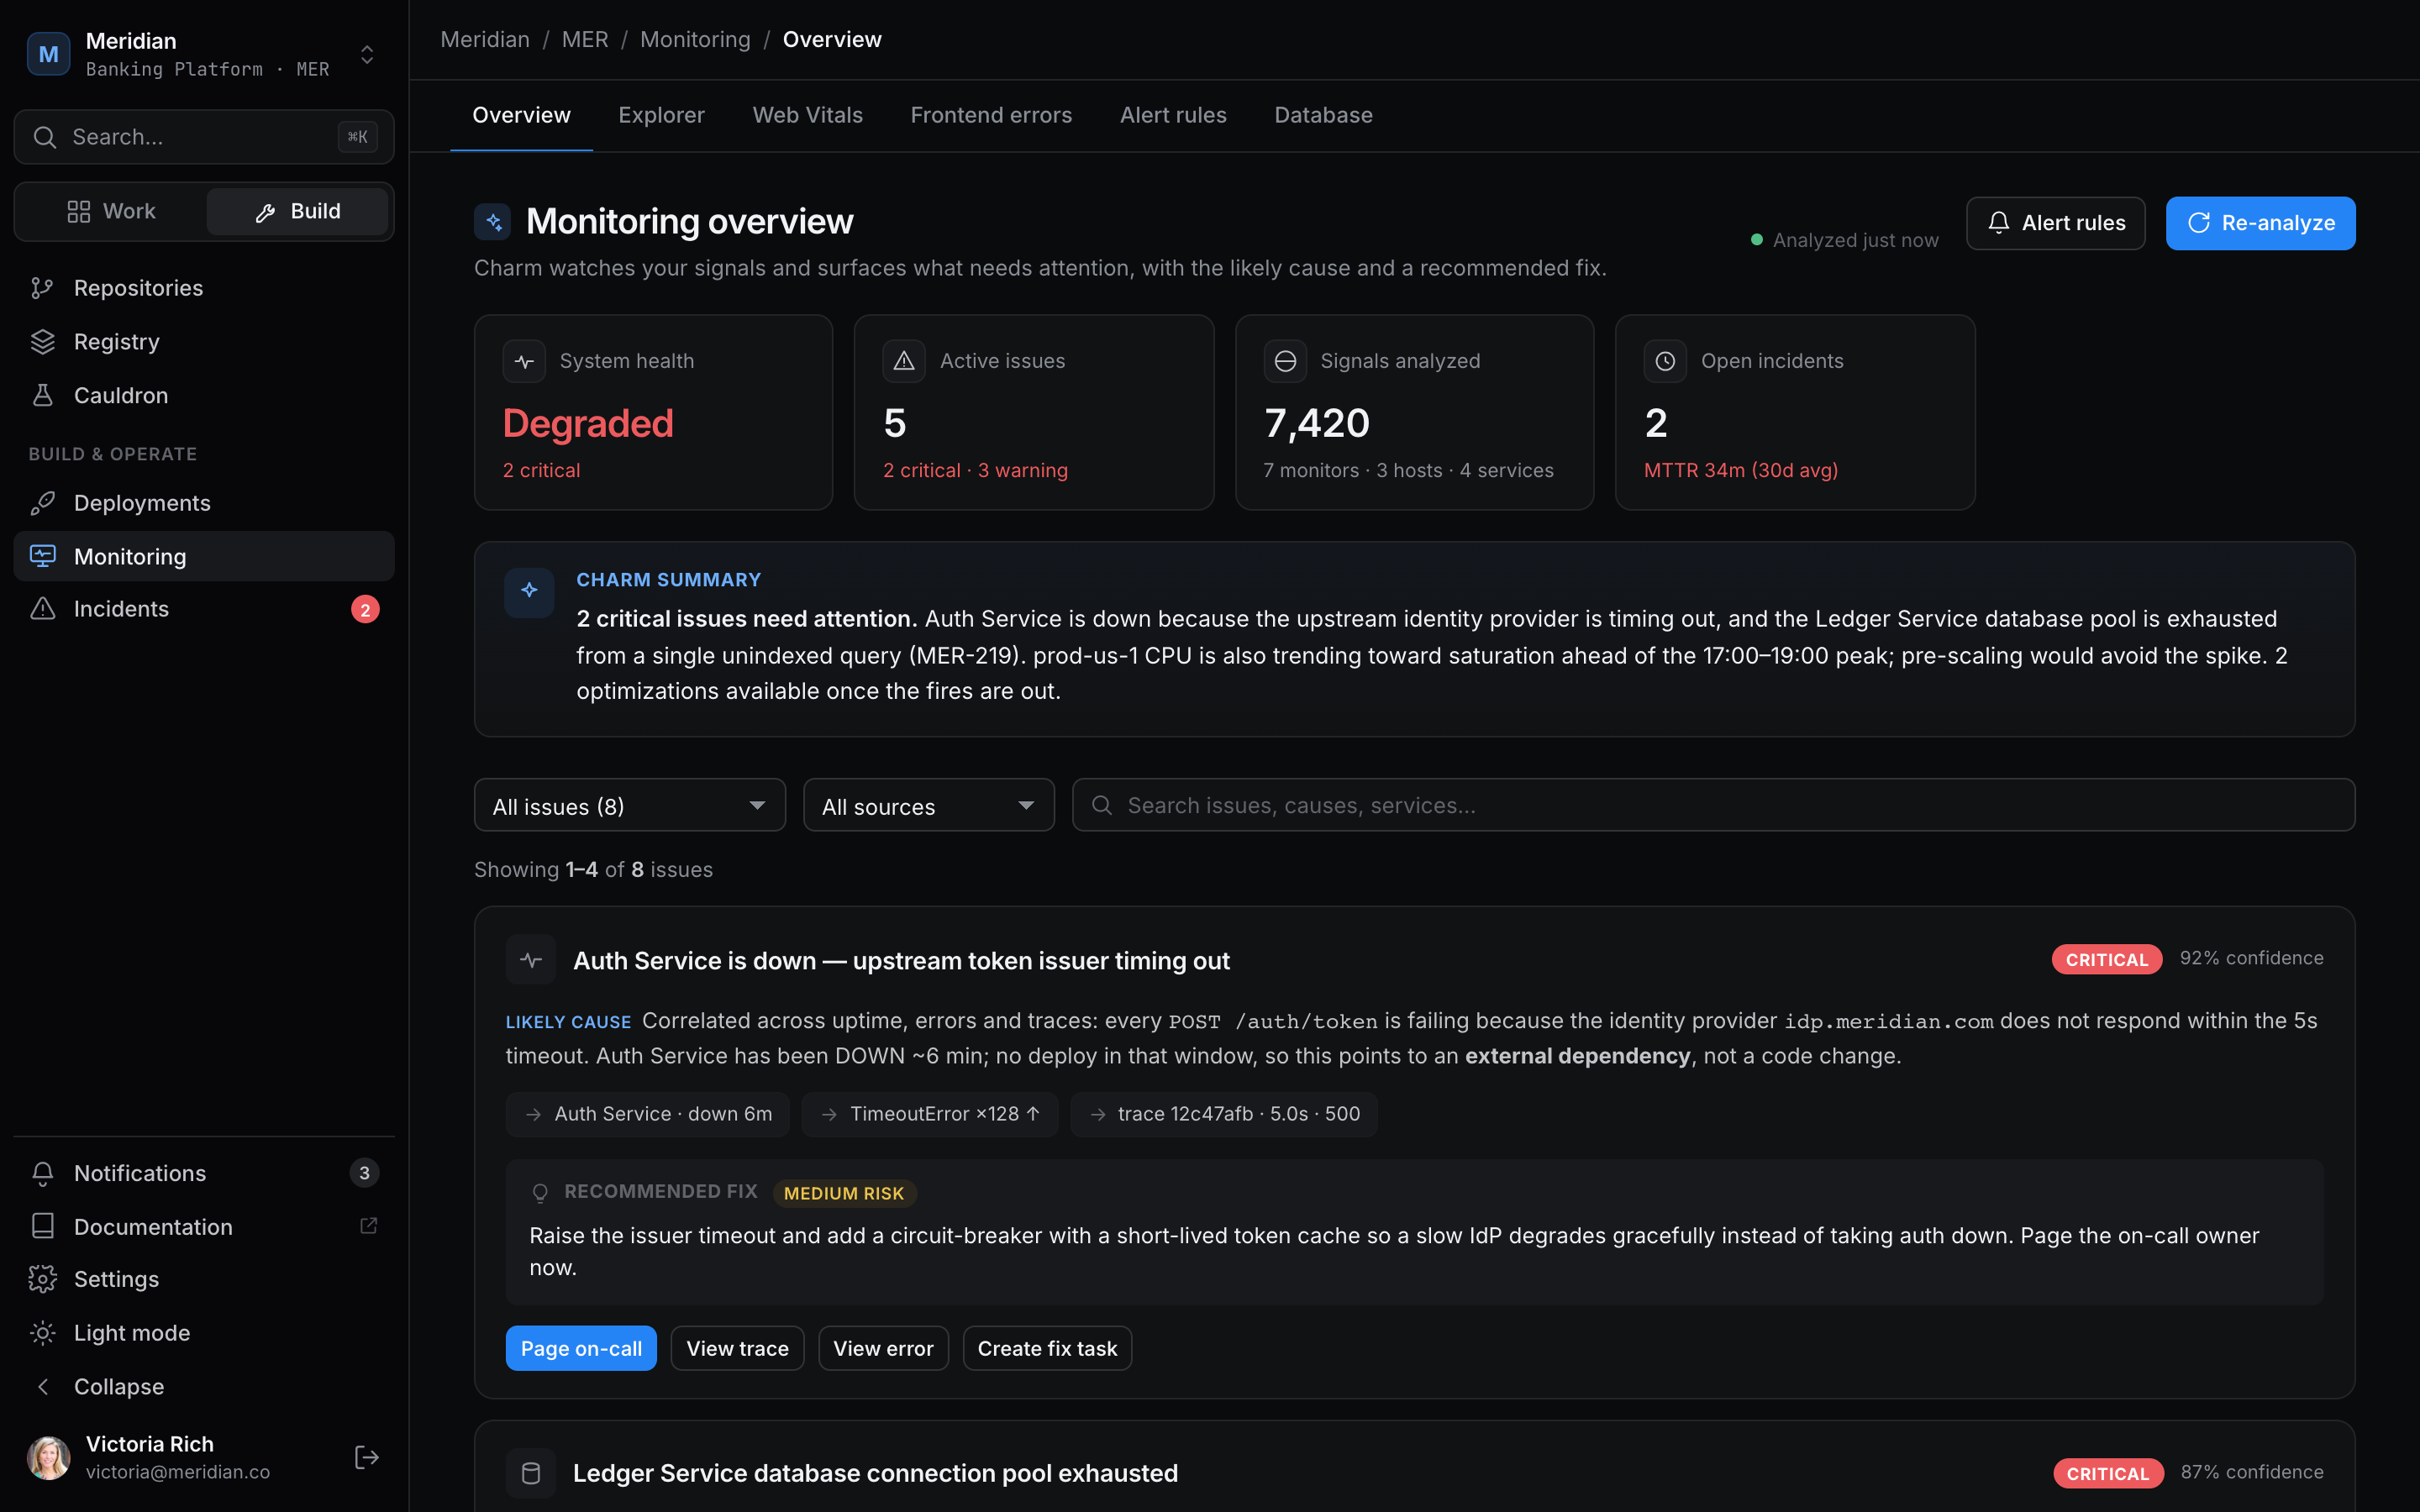
Detect, measure, correlate.
Three layers of observability that work together, so a slow request, a flapping monitor, and a noisy error all point to the same root.
Detect
Uptime probes, status pages, and grouped errors. The first signals that something is wrong, captured the moment they appear, routed to the right responder.
Measure
Application and infrastructure metrics, distributed traces, real user web vitals. Quantify what's happening across the stack, including the database and the browser.
Correlate
Logs, gateway requests, and a service-dependency map. Tie the metric spike to the failing trace, the error to the deploy, the deploy to the Task.
Nine signals, one surface.
From edge to backend to browser, every layer instrumented, every signal correlated. Go as deep as the problem demands.
Uptime monitoring
HTTP, TCP, and DNS probes from multiple regions. Configurable intervals, retry policies, and thresholds. Alerting on flap detection.
Error tracking and ingest
Errors deduplicated by fingerprint with frequency, first-seen, last-seen, and impact stats. Ingest API for any language or runtime.
Infrastructure metrics
CPU, memory, disk, and network for every container. Database query latency, connection counts, slow queries. Background job throughput.
Application metrics and alerts
Custom counters, gauges, and histograms from your application. Threshold and anomaly alerts route to email, Slack, or your on-call rotation.
Distributed tracing
Trace requests across services. Auto-discovered service-dependency map. Drill into the slowest span, the failing call, the retry storm.
Real user monitoring
Session replay, web vitals, frontend errors, and user journey analytics. See exactly what your users saw when something went wrong.
Container logs
Structured logs from every container, searchable by service, level, and timestamp. Pin a tail. Filter by request ID. Save common queries.
Gateway request logging
Every request through the edge gateway captured: method, path, status, latency, user agent. Filter, group, and chart in seconds.
Database monitoring
Query health and performance. Slow-query surfacing, connection pools, and replica lag. The database layer made legible.
Every issue arrives already root-caused.
The overview correlates uptime, logs, metrics, and traces into one card. It tells you what broke, shows the evidence it drew the conclusion from, and attaches the fix actions you would have reached for anyway. You confirm the call instead of starting the hunt.
- The conclusion sits at the top, with severity attached.
- The signals it reasoned from are listed, so you can check the work.
- Open an incident or a Task in one click from the same card.
429 spike on disputes-api
Chargeback submissions are returning rate-limit errors. The overview traced the spike to a single upstream caller hammering the dispute intake route.
Evidence
- Logs: HTTP 429 on POST /disputes, climbing
- Metrics: request rate above the configured cap
- Trace: retries fanning out from mobile-bff
Every signal traces back to the work that produced it.
Errors link to deploys. Deploys link to Tasks. Tasks link to knowledge entries. The graph is built in, not bolted on.
Errors to deploys
Every error grouped by fingerprint with the deploy that introduced it. First-seen, last-seen, and impact attached.
Traces to services
Auto-discovered service-dependency map. Drill into a request and watch it flow through every hop.
Logs to requests
Filter by request ID. Pin a tail. Cross-reference logs against the trace and the metrics for the same window.
Related capabilities
Observability is the start of the loop. Here is where its signals lead.
Every signal. One pane of glass.
Uptime, errors, traces, real user data, correlated to the Tasks that produced them.