

Read conclusions, not noise.
Most monitoring hands you a wall of charts and lets you find the problem. JuhJuh's AIOps overview does the first pass for you. It aggregates the signals and surfaces root-caused, evidence-backed issue cards with fix actions already attached.
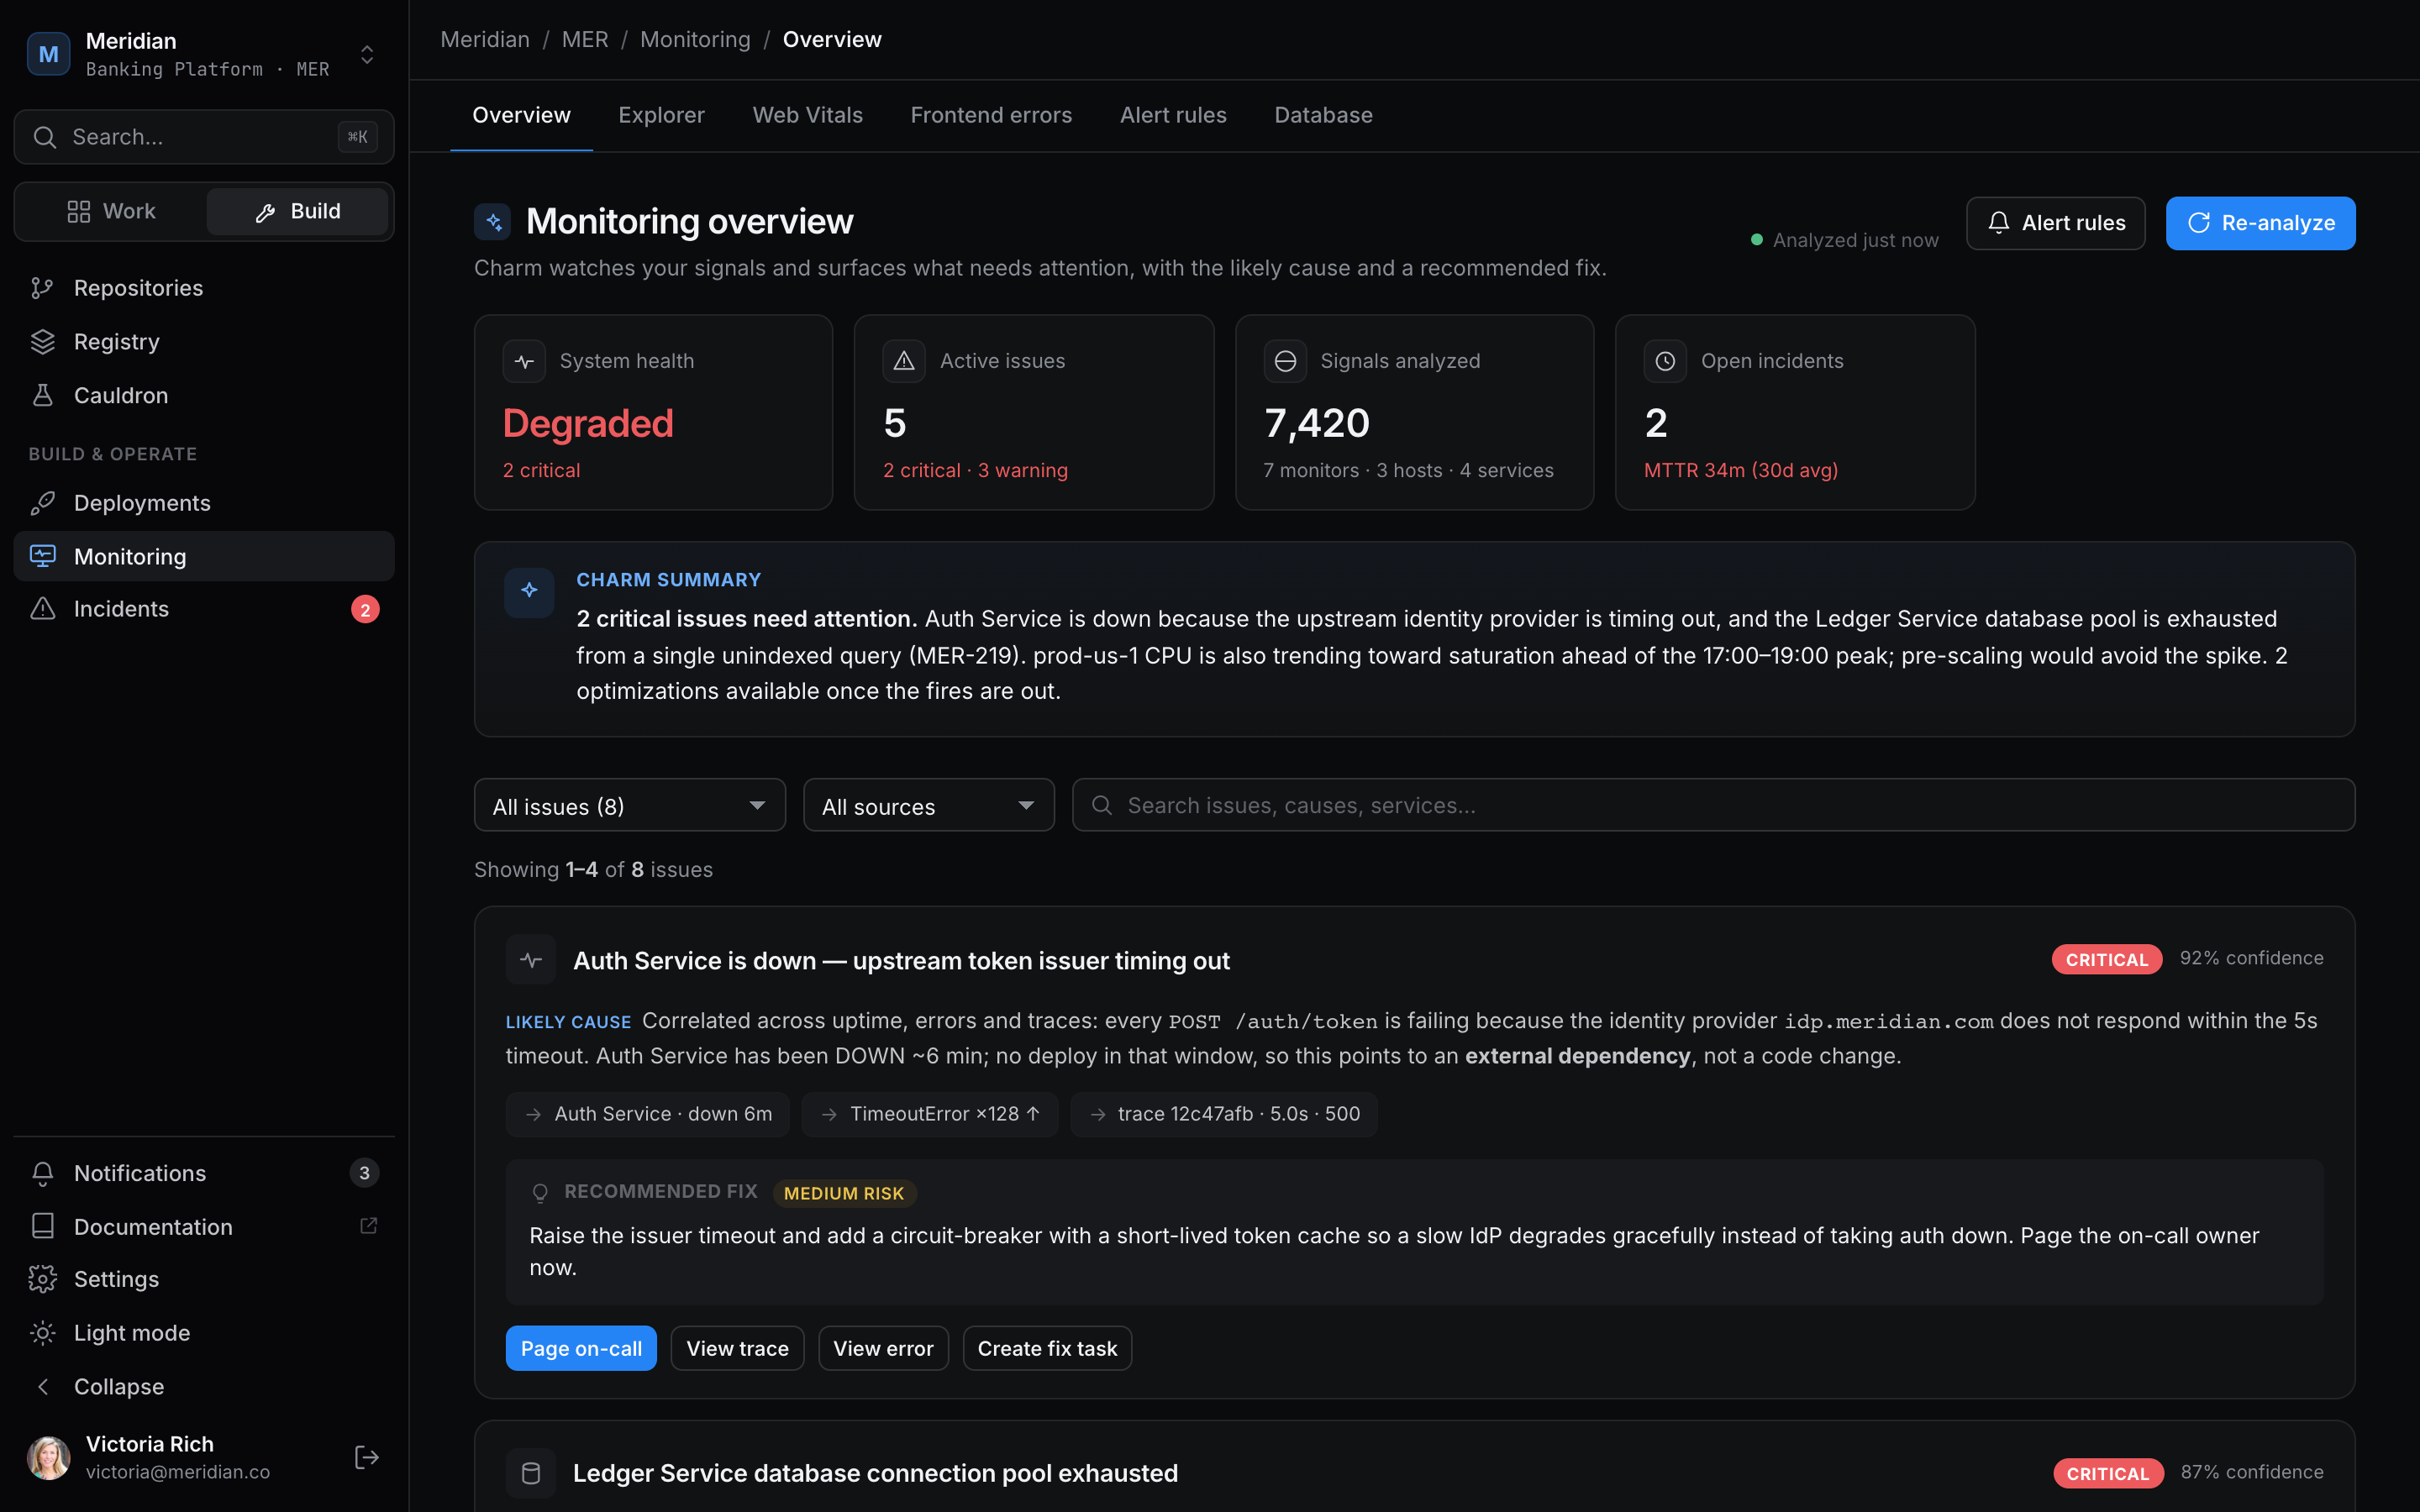
Start from the conclusion, then go as deep as the problem demands.
Uptime
Is it up, from where, and for how long.
Logs
Live-tail and search across services.
Error Tracking
Group, triage, and resolve.
Metrics
The numbers that matter, charted.
Traces
A request waterfall and a live service map.
Session Replay
Watch what the user actually did.
Database monitoring
Query health and performance.
Real user monitoring
Web Vitals, frontend errors, and real sessions, from the browser in.
Every issue arrives already root-caused.
The overview correlates uptime, logs, metrics, and traces into one card. It tells you what broke, shows the evidence it drew the conclusion from, and attaches the fix actions you would have reached for anyway. You confirm the call instead of starting the hunt.
- The conclusion sits at the top, with severity attached.
- The signals it reasoned from are listed, so you can check the work.
- Open an incident or a Task in one click from the same card.
429 spike on disputes-api
Chargeback submissions are returning rate-limit errors. The overview traced the spike to a single upstream caller hammering the dispute intake route.
Evidence
- Logs: HTTP 429 on POST /disputes, climbing
- Metrics: request rate above the configured cap
- Trace: retries fanning out from mobile-bff
When something breaks, run it properly.
Severity, a timeline, and a post-mortem when it is over. Build alerting from scratch or from 18 alert-rule templates, set metric alerts, and put on-call schedules and escalation policies behind them.
- Severity and a running timeline
- Post-mortems when the incident is over
- 18 alert-rule templates, or build from scratch
- Metric alerts on the numbers that matter
- On-call schedules and escalation policies
A public status page, no separate tool to maintain.
A public status page keeps the people who depend on you informed. It lives where the work does, so the customers who count on Meridian see the truth without you running a second tool to keep it in sync.
Public status page
Current health per service, posted the moment an incident opens.
One source of truth
No copying updates between tools. The page reflects what is actually happening.
An issue found in production becomes a Task. That Task turns into a reviewed result, and the reviewed change leaves you with a calmer dashboard. Observability is where the workspace proves the fix worked.
See production clearly.
Start from the conclusion and let the agents close the loop.